Armita Kar
PhD Candidate
Our travel needs and experiences differ depending on age, gender, race, and income. We use these past experiences and concerns regarding street conditions and safety to choose our everyday mobility. Thus, a transportation system that addresses these mobility concerns and eliminates its problematic parts will ensure better and safer access to essential services. Such an accessible transportation system is critical to achieving economic stability, urban equity, health, and environmental protection. In our study on inclusive mobility, we adopt a bottom-up approach to learning about people's mobility needs and concerns. Later, we measure the access of individuals and communities to essential services considering their spatio-temporal activity patterns and mobility concerns. Finally, we plan to use this knowledge in designing need-specific accessibility-oriented multimodal transportation systems.
The inclusive accessibility measure designed in this study is a time geographic approach integrated with humanin-the-loop machine learning algorithms and network analytics. We use machine learning techniques to learn and predict individual-level mobility concerns and clustering and classification algorithms to generalize their similarities by social cohorts. Then, we use the space-time prism approach of time geography to explain accessibility based on human activities and spatio-temporal interactions and their deviations while accounting for mobility perceptions.
We are conducting a travel survey to capture the diverse travel experiences of Columbus residents. Participating in this survey is a 3-step process. The baseline and end surveys are online. In the pop-up survey, participants track their trips for 7-days using the ArcGIS field maps mobile app and share street photos of their routes. In the surveys, we ask participants to score different streets of Columbus based on their infrastructure conditions, safety, and the quality of the surrounding environment.
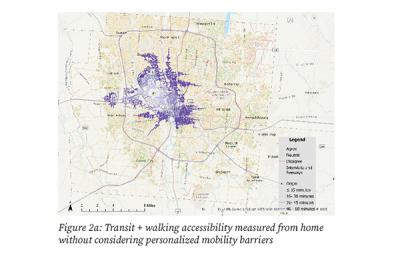
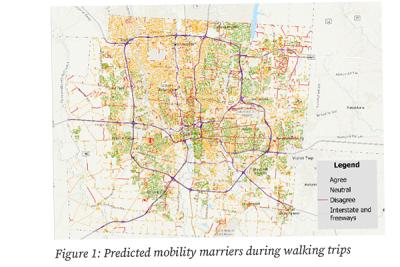
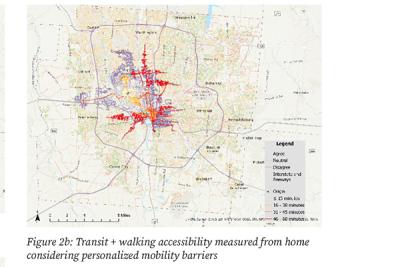
Here, we illustrate the study concepts using the survey dataset of one user. The user provides their willingness to walk on certain streets (green: agree; red: disagree; orange: indifferent). Based on participants’ input about where they prefer to walk or not on a sample of streets in Columbus, we predict their reaction to other streets that are not included in the survey sample. Figure 1 presents this result, representing locations where the user may experience mobility barriers while walking on Columbus streets. We also analyze the extent to which the user can reach destinations, given the barriers that they face. Figure 2 shows how far the user can reach in an hour using transit and walking, starting from home at 8 am. Figure 2a outlines the “basic” accessibility based on the regular transit schedule with adequate sidewalks that can accommodate the user’s short walking access to the bus stops within 15 minutes. What if we take into account other psychological and physiological barriers that we identified in Figure 1? Figure 2b presents accessibility after eliminating the road connections where the user has more concerns and does not prefer to walk. As we can see, considering these barriers significantly shrinks this person's walking and transit access. The area that feels accessible to the user is much smaller than the area measured as accessible using the basic approach, which is widely used in the existing literature.
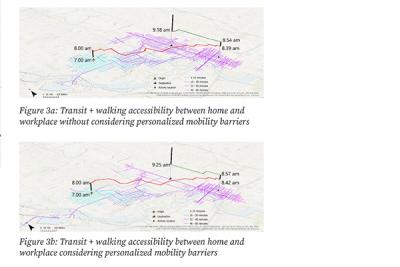
We can now apply this to a real-world scenario. Let's say the user needs to be at work by 9.30 a.m. and plans to drop by a pharmacy during the trip. The errands at the pharmacy will take at least 15 minutes. Figure 3 presents accessibility as a combination of all possible routes that the user can take between home and office and visit any pharmacy across that route. If this person takes any of these routes, s/he will be able to spend at least 15 minutes at the pharmacy and reach the office on time. The difference between Figure 3a and 3b is the consideration of mobility barriers. As we can see, the area accessible to the user becomes much smaller when we do not use the streets with higher mobility concerns in route planning (Figure 3b) compared to the basic measure, including all streets (Figure 3a). Let’s see an example route visiting the same pharmacy for both cases during the trip between home and office. The trip start and end times are shown on the maps. The vertical lines indicate how long the person stays at each location. As indicated, the trip takes longer when we plan routes considering the mobility barriers (Figures 3a and 3b).
The social contributions of this study are multifaceted. Accessibility measures designed in this study mirror personalized and community-specific mobility needs and perceptions. This measure will help us explain the inequalities around the urban transportation system from a mobility justice perspective. Practitioners and researchers may apply this measure to plan for cities that ensure free and affordable movement across all transportation modes and safe travel experiences for all communities regardless of their identities.