
Commodity Chain Projects: GEOG 2400
Commodity chain projects are a decades-old mainstay of teaching geography. During the pandemic, supply chains of all kinds—from pharmaceuticals to toilet paper—have become increasingly visible to the public, which makes a geographic understanding of commodity chains more relevant than ever. This semester in GEOG 2400, Economic and Social Geography, we are in the fourth semester of implementing a robust, multi-layered commodity chain research project as the course final. The goal of the project is for students to understand the hidden world of people and places embedded in the mundane commodities we consume every day. Following University goals, this commodity chain projects is a critical means to cultivate global citizenship for a diverse world. The final project shows students that when they buy something—a phone, a t-shirt, a cup of coffee—they literally reproduce the lives of people they’ve never met and of places they’ve never been, simply by virtue of perpetuating the production and exchange of commodities. Students come to see how they’re a link in a chain of activities, structures, and processes that occur in space, often at previously invisible sites. Ultimately, students discover that the way we consume ties us to these other people and places in ways that reveal a lot about contemporary political, economic, moral, and environmental struggles.
A geographic research project on commodity chains teaches students that the production and exchange of goods and services take place spatially – that is, through relationships between peoples, places, and processes distributed across the globe. By thinking spatially, we also teach students to think about space in terms of networks that operate at various scales (locally, regionally, globally) and are often the product of long-established historical linkages and relationships, as well as mediated through institutions such as banks, governments, and corporations. We emphasize how social and cultural processes (of difference) shape the production and consumption of commodities, including gender, race, sexuality, religion, nationality, age, class, etc. Emphasis on the production of difference reinforces the key takeaway of the class: Thinking spatially makes the “social” and the “economic” inseparable. Although these spatial relationships are always changing, the networks, processes, and structures are socially reproduced through our everyday activities. By connecting our worlds of consumption to the world of production we never see, and about which we know little, the course tells a geographical story of globalization. This story is not just about increasing economic interdependency and spatial integration but also about the way interconnection is also socially and spatially uneven, and therefore often unequal. We link these intertwined prompts through three clusters of questions: What are the links? Why those links? And what are the stakes?
Commodity chains can be particularly challenging precisely because they are an exploration into the “hidden” world of commodities. It’s challenging to trace commodities from start to finish. Thus, we teach students not to be discouraged by these “failures” but to take them as opportunities to think creatively. Beyond teaching critical research and writing skills, the final project includes an audio-visual presentation that students to share with (and learn from) their peers. We’ve adapted this component for both in-person and online versions of the course. In previous semesters, students completed the project individually and selected their own commodity. With this format, we broke up the various prompts into multiple scaffolding assignments that were staggered throughout the semester.
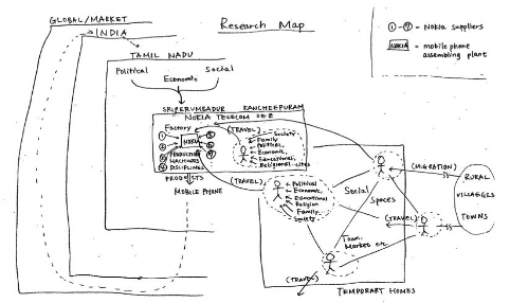
This semester, we’ve decided to make the project a collaborative research project, and we pre-selected and assigned commodities. In addition to individual in-depth research on specific aspects of the commodity chain, the aim of the collaborative component is to facilitate the skills required to work collectively: sharing ideas and responsibilities along with providing peer support. We’ve selected both classic commodities such as cotton, coffee, fossil fuels, lithium, rubber, and corn alongside commodities that students may be less familiar with as a commodity. These new additions are narcos, or illegal drugs typically analyzed outside legal commodity exchange; software/platforms, which are less tangible than classic commodities with a clear site of extraction or cultivation; and care, which is often thought of as reproductive work in ways that are outside the sphere of production and thus the economy proper. In selecting narcos, we highlight the innovative work done in our Department by Professor Kendra McSweeney on the relationship between drug trafficking and environmental change in Central America. To introduce the project and provide initial guidance in the new fully online course setup, we held multiple project orientation workshops this semester. In the workshops, we demonstrated the role of diagramming and visualization in gathering and organizing information. To this end, we presented a diagram made by the course instructor, Professor Madhumita Dutta, during her previous research on Nokia factory workers in India.
In providing initial research guidance, course TA Brookes Hammock provided a demo for “getting started.” Using geographer David Harvey’s oft-cited attention to China’s massive consumption of concrete in recent years, Brookes illustrated how to start researching concrete, an aggregate commodity mostly made out of sand. By juxtaposing the fantasy image of sandy beaches with the harsh reality of global sand extraction, Brookes demonstrated to students how researching “sand mining” quickly ruptures that imaginary. Using images of Haitian sand mines and Indian sand dredging, Brookes highlighted how labor exploitation and environmental degradation are immanent to nearly every commodity, down to a handful of sand. Overall, we strongly emphasize the role of laborers, who are often absent from the origin stories of commodities. We plan to hold one more workshop in April to provide logistical guidance for finalizing audio-visual presentations.
Ariel Rawson, PhD Candidate
2020 Sharpe Innovation Commons Seed Grant
Exploring the Benefits of Downscaled Remote Sensing Soil Moisture for Drought Monitoring
Team Members: Zack Leasor, Chen Zhao (Synoptic Data), Luyu Liu
Faculty Advisor: Dr. Steven Quiring
Improved methods for visualizing drought at a fine resolution can help to bridge the gap between drought severity classifications and local impacts. Soil moisture data are critical for drought monitoring because they can provide reference measurements of meteorological and agricultural drought conditions. Recent advances in remote sensing technology have provided additional tools for monitoring near-surface soil moisture across the continental U.S. (CONUS). However, the resolution of remote sensing soil moisture is often too coarse for some hydrological applications. Therefore, our project has provided a proof of concept downscaling approach by utilizing machine learning methods in conjunction with climate and environmental data. A random forest model was created to downscale gridded soil moisture at a 9 km resolution from the NASA Soil Moisture Active Passive (SMAP) mission. Results demonstrated the ability of this model to produce 1 km gridded soil moisture that is significantly different from the original SMAP L4 soil moisture (Figure 1). Examining the random forest variable importance provides an opportunity to explore linkages between soil moisture and environmental variables (Figure 2). These results were presented at the 2021 American Association of Geographers Annual Meeting. Future research will continue to improve model performance by exploring hyperparameter tuning in random forest models and considering other variables which may improve the downscaled product. The 1 km soil moisture data will also be considered for use in drought mapping and crop yield applications. This research team will also work to to produce downscaled soil moisture maps in near real-time by exploring methods for visualizing and hosting downscaled maps on the web.
Summary of Findings
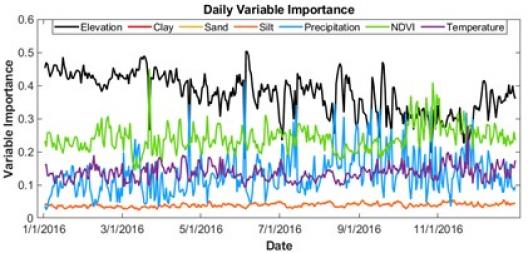
This project is designed to visualize national soil moisture characteristics at a fine resolution to improve drought monitoring at local scales. Recent advances in remote sensing technology have provided additional tools for monitoring near-surface soil moisture across the continental United States (CONUS). However, the resolution of remote sensing soil moisture is often too coarse for some hydrological applications. Therefore, our project has provided a proof of concept downscaling approach by utilizing machine learning methods in conjunction with climate and environmental data. A random forest model was created to downscale 9 km Level 4 (L4) gridded soil moisture from the NASA Soil Moisture Active Passive (SMAP) mission. Results demonstrated the ability of this model to produce 1 km gridded soil moisture that is significantly different from the original SMAP L4 soil moisture. Examining the random forest variable importance provides an opportunity to explore linkages between soil moisture and environmental variables (Figure 1). Elevation is the most important variable to consider when downscaling soil moisture while soil texture characteristics are the least important variable to consider. Atmospheric variability influences daily fluctuations in variable importance for temperature, precipitation, elevation, and NDVI data. However, model validation demonstrated that the random forest downscaled soil moisture was less accurate than the SMAP product downscaled by nearest neighbor against in situ measurements. Nearest neighbor method, which only utilized the SMAP L4 data, displayed higher correlations and lower error metrics against in-situ data. These results were presented at the 2021 American Association of Geographers Annual Meeting (https://aag-annualmeeting.secure-platform.com/a/solicitations/13/sessiongallery/931/application/2625).
Web Mapping, Dissemination, and Future Research
soil moisture data.
Future research will continue to improve model performance by exploring hyperparameter tuning in random forest models and consider other variables which may improve the downscaled product. The 1 km soil moisture data will also be considered for use in drought mapping and crop yield applications. This research also seeks to produce downscaled soil moisture maps in near real-time. Future research will explore methods for visualizing and hosting downscaled maps on the web. Web map demo: https://luyuliu.github.io/sharpe/visualization/